Free Signals de Indicator Tools
With the technical indicator, you get a quick and educational overview of the main signals by timeframe. A smart tool to help traders of any level.
To test the signals, create a demo account if you don’t have one yet.
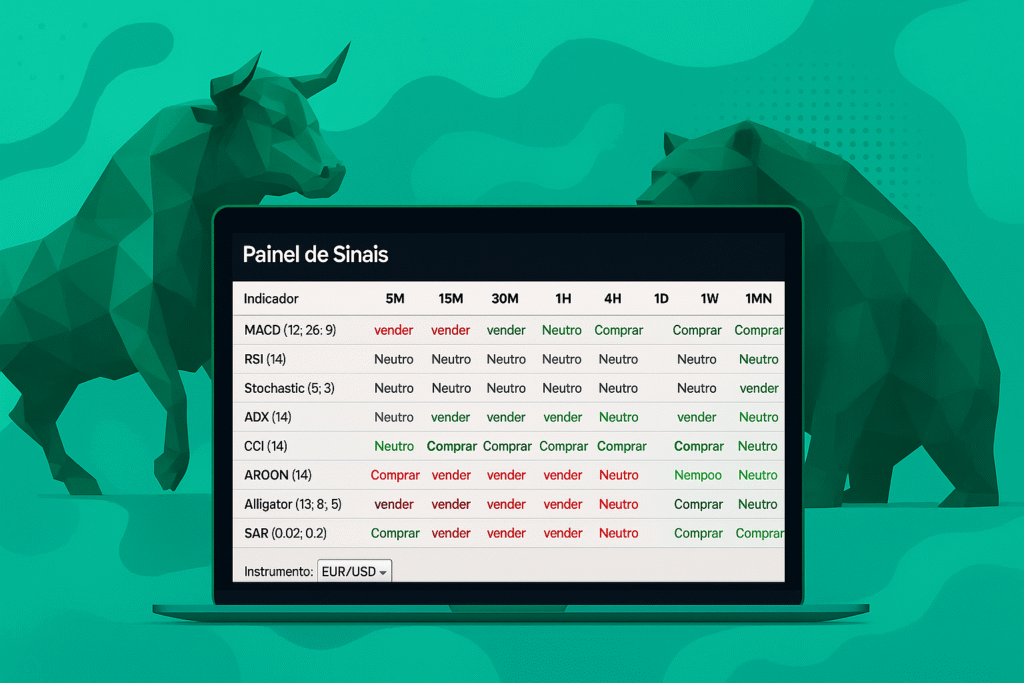
The Technical Indicator is a technical analysis tool that provides an overview of trading signals based on the most popular indicators: Moving Average Convergence Divergence (MACD), Relative Strength Index (RSI), Stochastic Oscillator (Stochastic), Average Directional Index (ADX), Commodity Channel Index (CCI), Aroon Oscillator (AROON), Alligator, and Parabolic Stop and Reverse (SAR). The widget translates indicator values into three types of signals: “Buy,” “Sell,” and “Neutral.”
Signals are available for several well-known Forex instruments with high liquidity, for periods ranging from five minutes to one month.
How it works
The panel below gathers signals generated by popular indicators (MACD, RSI, Stochastic, ADX, CCI, Aroon, SAR), translating them into Buy/Sell/Neutral for multiple time periods (5 minutes to 1 month).
Signal Panel
If you are using a cell phone, turn it horizontally to have a wide view.
How to Use the Dashboard for Your Entries
The signal dashboard shows, for each timeframe, whether there are more buy or sell indicators.
The rule is simple:
- More green (buy): CALL entry (buy).
- More red (sell): PUT entry (sell).
Divided or neutral: it’s best to wait until the market provides a clearer direction.
✅ Entry Validation
For a reliable signal, it’s recommended that at least three indicators align in the same direction.
Example: if five indicators appear and only two indicate a buy, it’s not safe to enter.
If three or more confirm a buy, the signal is more consistent for a CALL entry.
The same applies to sell: a minimum of three indicators must point to a sell to validate the PUT.
⏳ Expiration according to the timeframe
M5 e M15: fast expirations (5 to 30 minutes).
M30 e H1: 30- to 60-minute expirations.
D1, W1 and MN: Long expirations, for longer movements.
👉 Having one or two signals isn’t enough; you need a minimum of indicators confirming the direction before entering.
Economic Calendar News
Main Technical Analysis Indicators
In trading, various technical indicators help to understand market behavior, whether to measure trend, strength, or identify entry and exit points.
Each indicator has a specific function and can be used together to improve decision-making. Below is a summary of the main ones:
| Indicator | What it measures | How to interpret |
|---|---|---|
| MACD | Direction and strength of trend | Line crossover indicates buy or sell |
| RSI | Relative strength level | Above 70 = overbought; below 30 = oversold |
| Stochastic | Current price vs. recent range | Above 80 = overbought; below 20 = oversold |
| ADX | Trend intensity | Above 25 = strong; below 20 = weak/sideways |
| CCI | Distance of price from average | Above +100 = high; below -100 = low |
| Aroon | Time since last highs/lows | Shows if trend is up, down, or undefined |
| Alligator | Three moving averages | Lines spread = trend; lines close = consolidation |
| Parabolic SAR | Entry and exit points | Points below = bullish; points above = bearish |
Frequently Asked Questions
How does the robot trade?
The robot opens trades based on technical analysis: it investigates asset price fluctuations using the candlestick method. 63% of our users with a $100 deposit earn $30 on the first day. To do this, customize your robot according to your goals and risk profile.
How much money do I need to start trading?
You can try the robot in a demo version without having any money in your account. However, to start trading for real, you’ll need to make a minimum deposit of $50. This will allow you to take full advantage of the robot and better implement your strategies, especially in cases where trades may result in losses.
I already have an Avalon account
If you have an account on the Avalon platform, you can access the app with it. With a new account, you’ll have access to live trading and tools for more efficient trading. Sign up with your new email address; it’s safe and easy.
What is a demo account?
A demo account is a training account that requires no deposit to use.

Create your demo account on the official website.

Analyze the Technical Indicator dashboard.

Choose a pair and a timeframe.
